2025 Feature Roundup
Happy New Year! In 2024 we added a lot of option related features and are pivoting the brand messaging to helping individual investors apply options to value-oriented analysis.
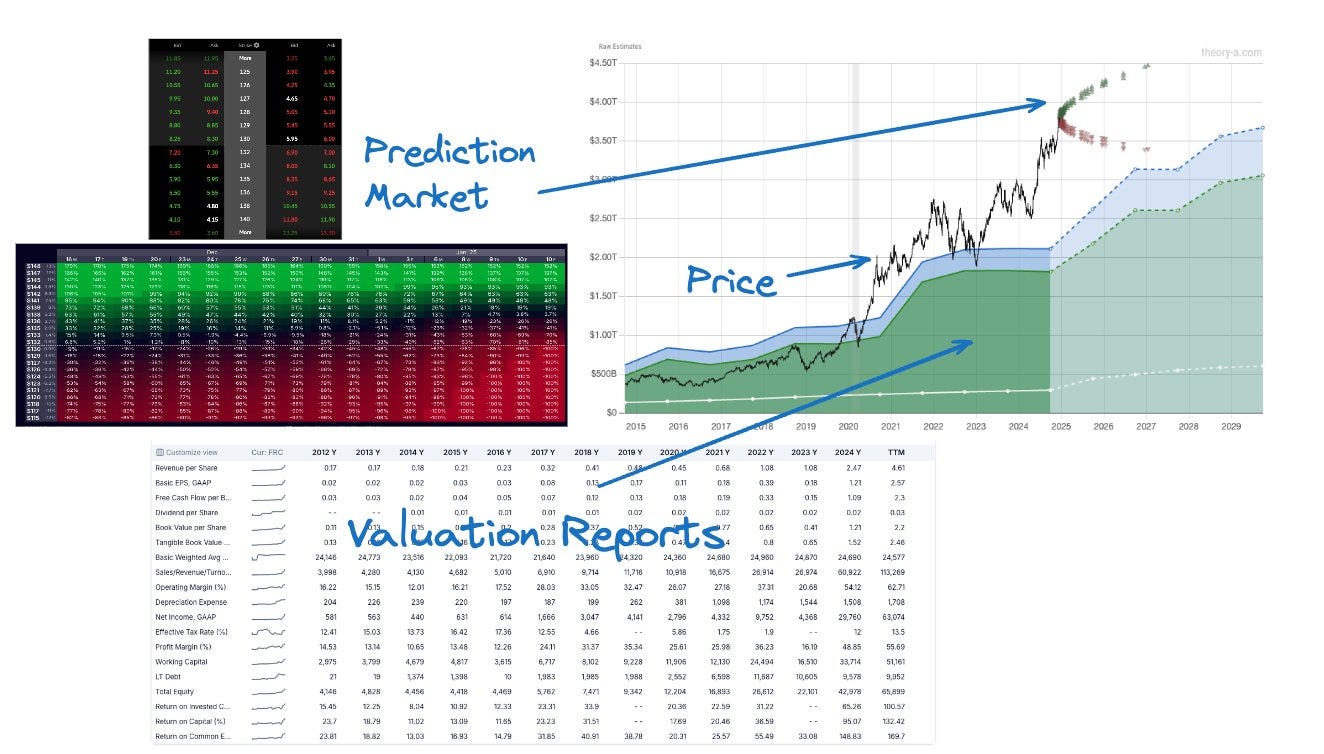
This is a hybrid form of investing because option-traders are stereotypically looking for short-term gains while value investors stereotypically hold for long periods of time. I want to propose a way of looking at things that combines both these philosophies and outlooks to get the best of both worlds and explain how our tools combine all this data into an intuitive bird’s eye view of the market.
Options Primer
Options are at their core a prediction market that compresses all the bets from market participants into a tangible form.
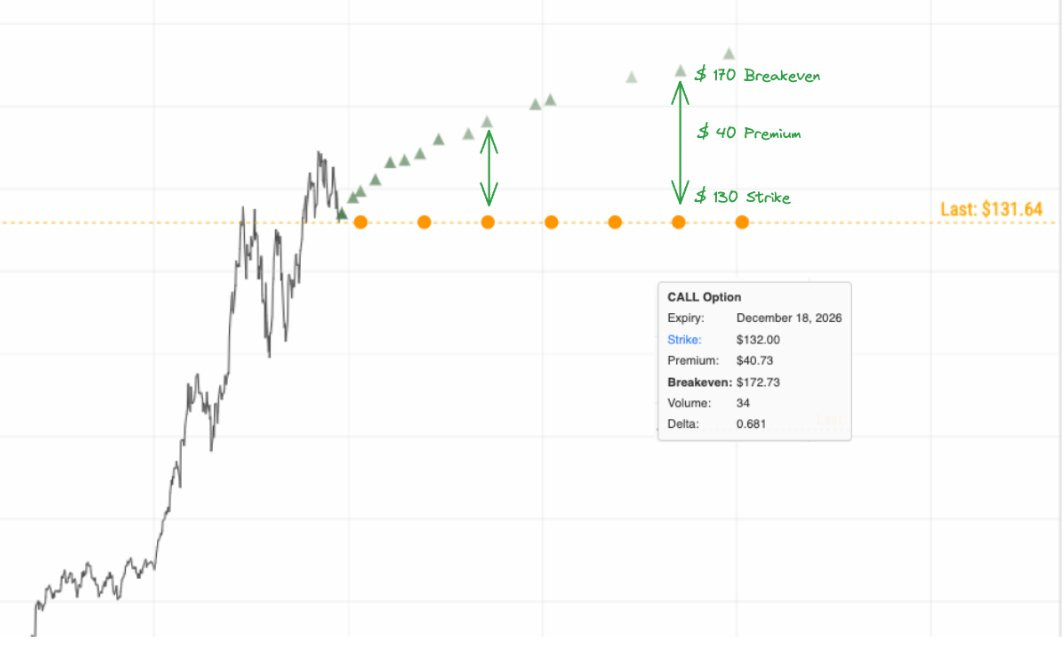
Below is a series of call options with strikes at the orange dots. The green triangles are the orange positions moved upwards based on the price of the premium. That is, the green triangles are the breakeven points.
If you think the black line will move above the green triangle by that expiry then you’d buy the option. If you don’t think it will, then you’d sell the option.
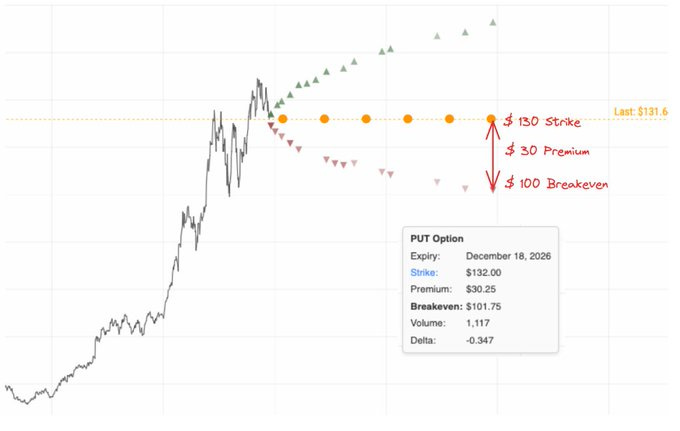
Visualize both the calls and the puts and you have a cone that represents what the options market is thinking. When the cone widens, it means that premiums have risen in expectation of larger price movements like an upcoming earnings report or controversial Elon Musk tweet.
This method of visualizing the option chain data within the context of price movements and at their expiry dates allows you to easily sense what the option chain is telling you.
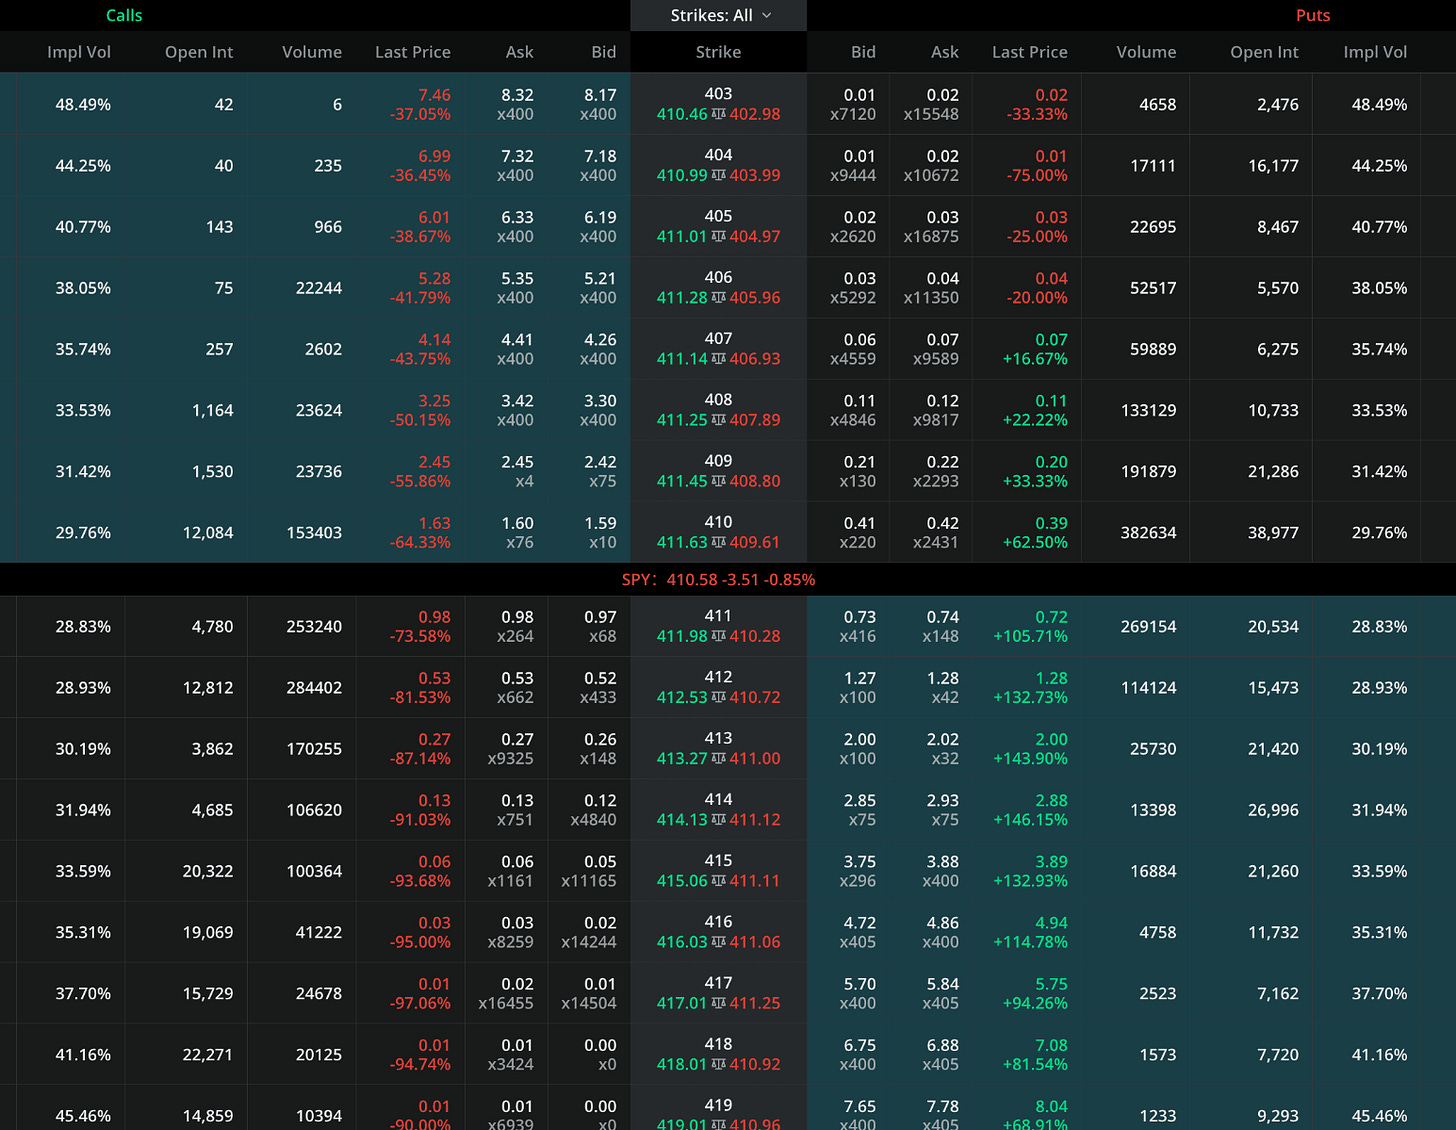
Compare it to looking at the raw data, there is no intuition at all, just a solid mass of decontextualized numbers.
Profit/loss diagrams too are de-contextualized. You see a very narrow slice of the world that hyper-focuses on a single thing.
Compare the above visualize of a single straddle vs all the ATM straddles plotted at their expiry dates. You can much more easily see how active trading is shaping the future price prediction.
Below is our 3D visualization of ATM straddles.
We will be creating some more in-depth guides on how to use these new tools in the future but first an example trade
NVDA & COST
If you look at NVDAs market overlay over its earnings and estimated earnings you can see that they are fairly correlated. Despite having a P/E near 60, NVDAs earnings growth does seem to justify this P/E.
If you look at COST on the other hand you’ll see that it has experienced massive P/E expansion over the last few years and its market cap has dislocated from earnings correlation.
Costco actually has a similar P/E to NVDA!
This is despite NVDA being a high margin technology company profiting from amazing advanced in AI while Costco is a capital-intensive warehouse based bulk shopping store.
One of these has to be wrong!
So to express this view let’s look at a put on COST and a call on NVDA
For the put on COST the below examples shows choosing a P/E of 35 that aligns with price support over the last few years. This allows you to mentally model how you expect the black line to move.
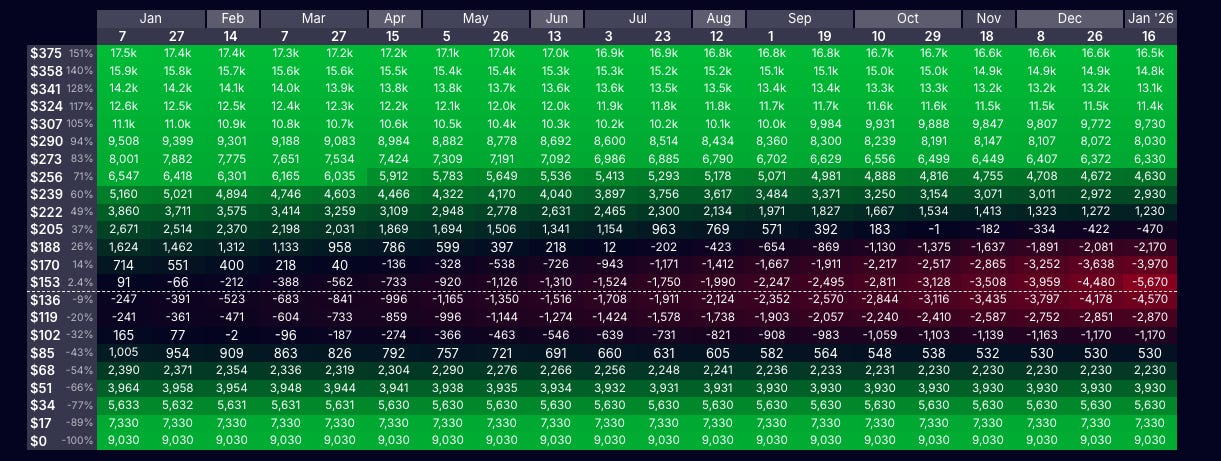
If you choose a contract (red triangle) that is too close, you’ll be vulnerable to random short-term price movements. However the December 18, 2026 option looks reasonable. It’s just under the current price and is 2 years out yet has an elasticity of or leverage effect of 4.8.
This is an ITM put (the strike is visualized via the blue dotted line) and the thesis is that the contract is too cheap and the premium should be higher.
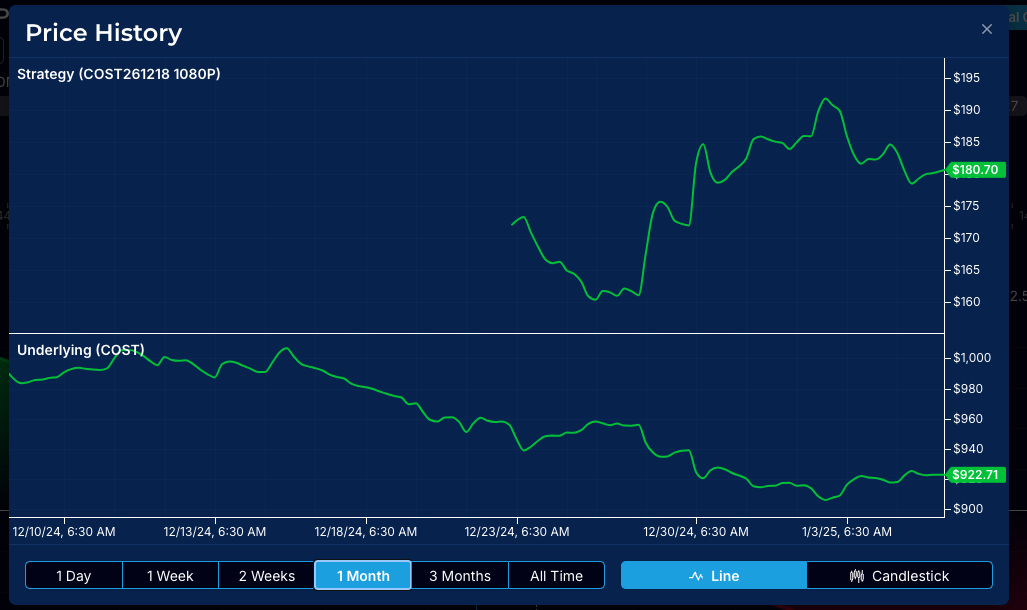
I opened a position 12/11/2024 which has done fairly well.
The price history of the contract can be viewed with a tool like optionstrat
With NVDA you have something similar.
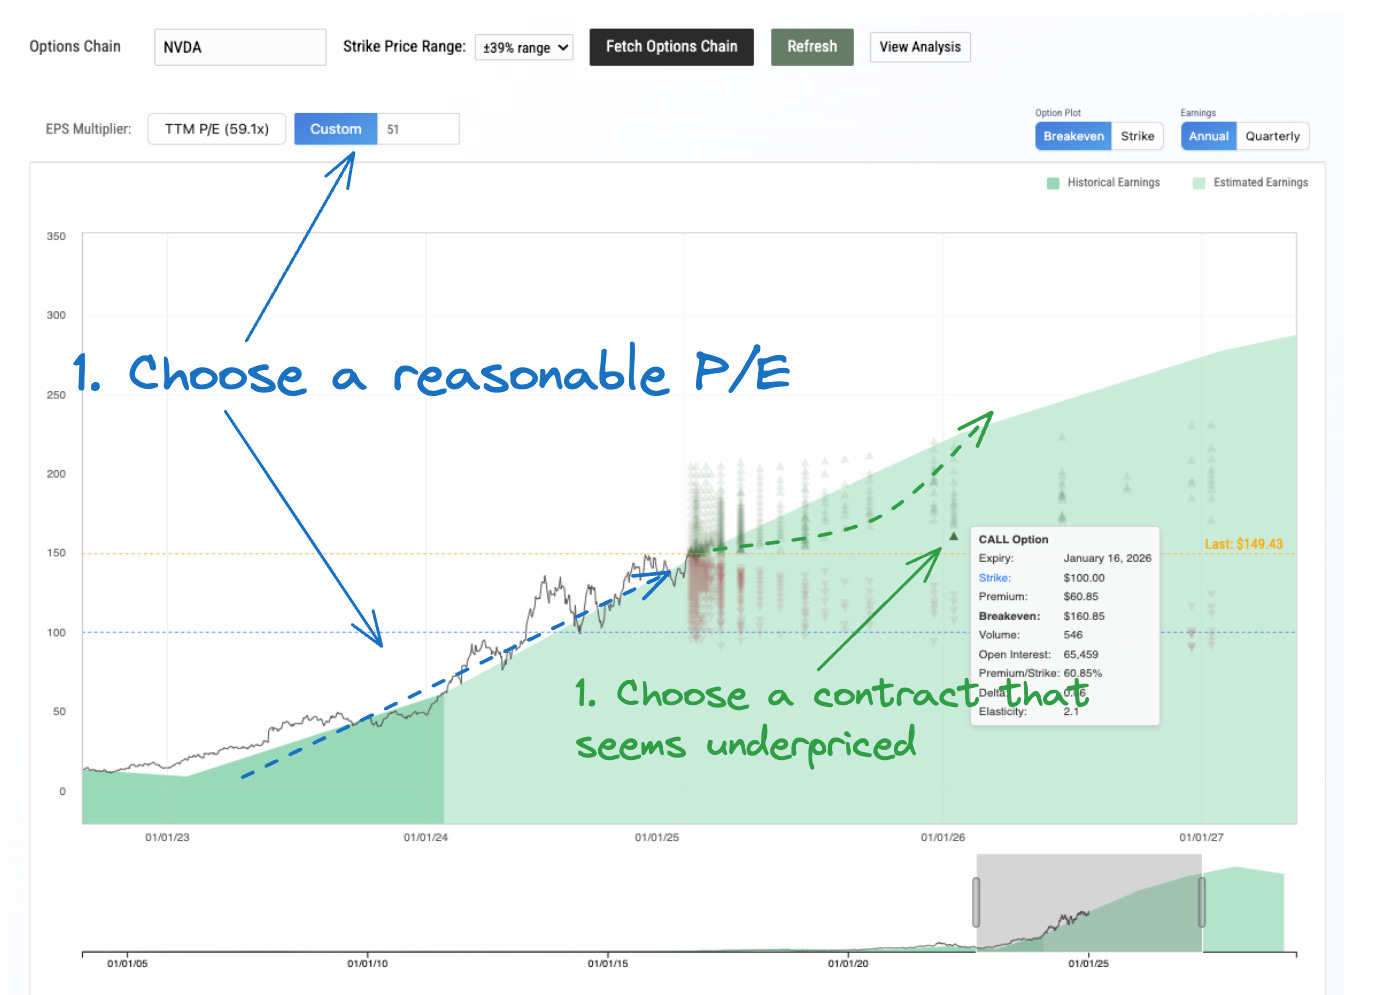
Here 50x is chosen as a “reasonable” P/E that shows good price support. Any contract with its breakeven position far under the green area is underpriced if the estimates and the price correlation hold true.
This one highlighted below is the Jan 16, 2026 100 Strike CALL so a pretty deep ITM call (delta of almost .9)
It’s a relatively safe option but it’s around 2x leverage/elasticity!
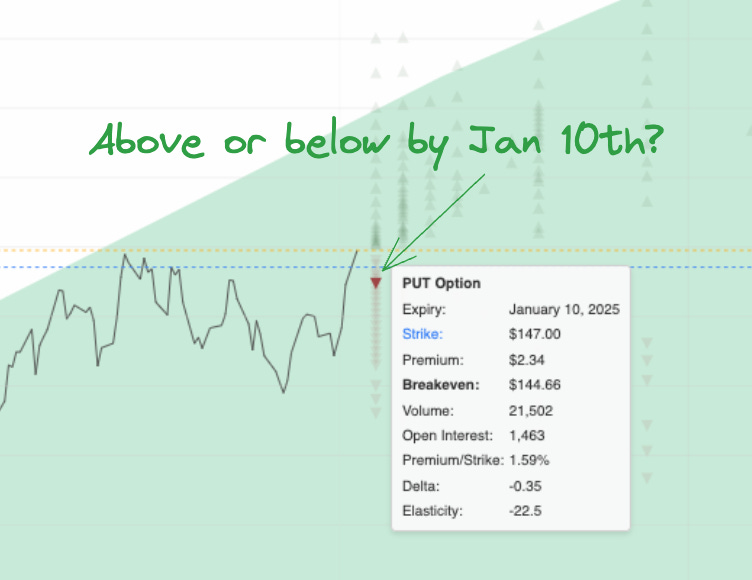
Options-based value investing is a way of using options to apply leverage to long-term ideas. Although shorter term options will have much higher leverage ratios like 20x or even 100x by overlaying our value charts we can see that short term options are very susceptible to random price movements.
Even if you are bullish on NVDA, zoom in and you can easily see how susceptible you are to luck when you buy a a near expiry option. The PUT below is a few days out and offers 20x leverage but is essentially a bet on the jerkiness or volatility of the price rather than a long-term thesis.


